In the world of data-driven marketing today, email marketing metrics are not just a bunch of numbers — they’re the GPS that’s going to tell you if your campaign is flying along to victory or roadblocked. From open rate to ROI, knowing your metrics will be the way to make better decisions, increase performance, and drive serious revenue.
Let’s dissect all you need to know — supported by 2025 strategies, industry benchmarks, and real-life strategies to make a difference.
What Are Email Marketing Metrics and Why Do They Matter?
The Role of Metrics in Campaign Performance
Email metrics are like your campaign report card. If your email is not being opened, clicked, or converting, it’s not working. Metrics reveal what’s performing, what isn’t, and where to adjust. If you’re just starting out, here’s a guide on Build an Email List That Converts: 12 Simple Tricks for 2025 to help set a solid foundation.
Aligning Metrics with Marketing Goals
Not every campaign is the same goal. A welcome series requires high open rates. A promo email? Clicks and conversions. Monitor the correct metric for the correct goal is the secret sauce.
Core Email Marketing Metrics You Must Track
1. Open Rate
Tracks how many of your recipients opened your email.
Good Benchmark: 20–30%
Tip: Write irresistible subject lines and avoid spammy words.
2. Click-Through Rate (CTR)
Percentage of opens with a click.
Good Benchmark: 2–5%
Pro Tip: Include strong call-to-action (CTA) buttons, not plain text links.
3. Click-To-Open Rate (CTOR)
Tracks clicks after an open.
Why it matters: It informs you how engaging your content is.
Good Benchmark: 10–15%
4. Conversion Rate
Informs you how many recipients performed the desired action — purchase, signup, etc.
Good Benchmark: 1–5% based on the offer.
5. Bounce Rate
Hard Bounce: Invalid or bogus emails.
Soft Bounce: Transient problems such as full inbox.
Good Bounce Rate: Less than 2%
Solution: Implement double opt-in and regularly clean your list.
6. Unsubscribe Rate
If this metric jumps, content may not be pertinent.
Good Benchmark: Less than 0.2%
7. Deliverability Rate
Emails delivered ÷ Emails sent.
Good Benchmark: 98%+
Improve by warming up domains, email list segmentation, and staying away from spam triggers.
Advanced and Often Ignored Metrics
1. Spam Complaint Rate
Anything over 0.1% is alarming. Provide transparent unsubscribe options and do not send cold lists out in bulk.
2. Email Sharing/Forwarding Rate
Gauges virality. Include “Share with a friend” buttons to increase it.
3. List Growth Rate
Monitor how quickly your list increases after promotions or lead magnets.
4. Block Rate
Marketers marking your email as “block” or “spam” — an ISP red flag.
5. Domain Click Rate
Reports performance of your email domain (particularly critical in Gmail, Yahoo).
6. Revenue Per Email
How much you earn per email sent. Ideal for eCommerce or affiliate campaigns.
7. ROI (Return on Investment)
The old master of all metrics.
Formula: (Revenue – Cost) / Cost
8. Total Orders and Sales
Best metric for conversion-driven emails.
9. Average Order Value (AOV)
Helpful for upsell and cross-sell campaigns.
Visualizing Email Metrics
1. Shopify Email Dashboard & Other Tools
Shopify, Klaviyo, ConvertKit — all have email dashboards with CTR, AOV, and more.
2. Google Analytics + UTM Tracking
Want to measure email performance on your site? Utilize UTM parameters and Google Analytics.
Benchmarking: What’s a Good vs. Bad Metric?
Industry Benchmarks You Should Know
| Metric | B2B Benchmark | eComm Benchmark |
|---|---|---|
| Open Rate | 22.5% | 18.8% |
| CTR | 2.6% | 2.1% |
| CTOR | 12% | 9% |
| Unsubscribe | <0.2% | <0.3% |
Mobile vs Desktop Engagement Benchmarks
Mobile open rates are rising. Make sure design is mobile-friendly.
Delivery Rate vs Open Rate
Good delivery but poor open? Your subject lines or sender name may be the problem.
Organizing Metrics by Funnel Stage
1. TOFU (Top-of-Funnel): Awareness
Pay attention to:
- Open rate
- List growth
- Spam complaint rate
2. MOFU (Middle-of-Funnel): Nurture
Monitor:
- CTR
- CTOR
- Email sharing/forwarding rate
3. BOFU (Bottom-of-Funnel): Conversion
Monitor:
- Conversion rate
- Revenue per email
- ROI, AOV, total orders
Diagnosing and Fixing Poor Metrics
1. Low Open Rate? Try These Subject Line Fixes
- Personalization (use first names)
- Emojis (in moderation)
- Curiosity-driven hooks
2. Bad CTR? Audit Your CTAs
- Make CTAs bold and prominent
- Restrict to one CTA per email
- Use urgency: “Only 2 hours left!”
3. High Bounce or Spam?
- Use double opt-in
- Filter out inactive users
- Don’t buy email lists
How AI Is transforming Email Metrics in 2025?
1. GPT-Driven Subject Lines
AI Tools now compose high-converting subject lines using AI. A/B test them!
2. Predictive Analytics and Segmentation
AI forecasts which subscribers will convert, enabling segmentation that’s smarter.
3. Automation and Real-Time Optimization
Marketing automation platforms auto-optimize send times and copy based on real-time engagement.
Optimizing Every Metric with A/B Tests
1. A/B Testing Subject Lines
Split test personalization, emojis, length, and format.
2. CTA Placement and Copy
Left or right? Button or link? One definite CTA always prevails.
3. Mobile vs Desktop Layouts
Preview for both — your metrics can take a hit with bad mobile design.
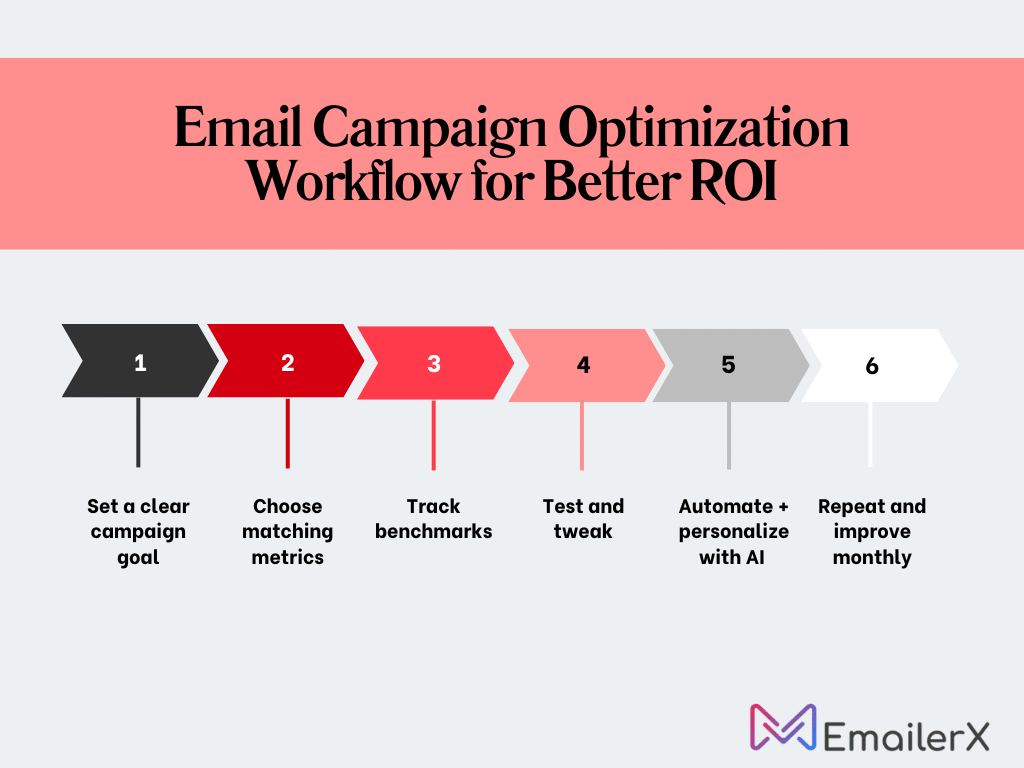
Campaign Optimization Workflow
Case Studies: Metrics in Action
Case Study 1: E-commerce Retailer Overcomes iOS 15 Challenges
A fashion retailer of a mid-size watched their open rates artificially climb 30% after the release of iOS 15. By pivoting to click-to-open rate and establishing a composite engagement score, they realized that their most engaged segments were responding equally well to campaigns. They boosted revenue 22% by doubling down on these top- performing segments while building re-engagement campaigns for others.
Case Study 2: B2B Company Transforms Click Performance
A software firm had a 1.2% CTR with decent open rates. Testing identified their emails had too many competing calls-to-action. By cutting CTAs back to one main action and one secondary action, and establishing a clean visual hierarchy, they raised CTR to 3.8% after three campaign cycles.
Case Study 3: Nonprofit Decreases Bounces and Enhances Deliverability
A nonprofit agency had deliverability problems with a 5% bounce rate. Through using a disciplined list cleaning process that eliminated emails that hadn’t interacted in 12 months and correcting authentication problems, they lowered their bounce rate to 1.2% in 60 days. Improved inbox placement brought them 30% more donations from their year-end appeal.
Conclusion
It’s not about numbers. It’s about understanding your audience, refining every campaign, and growing your business quicker and wiser. By getting to know the open rate, click-through rate, conversion rate, and more — you unleash the full power of your email strategy.
So go ahead, review your existing campaigns, apply these insights, and begin transforming email into your top-performing channel.
Frequently Asked Questions
1. How often should I review my email marketing metrics?
You should review your metrics weekly for active campaigns and monthly for ongoing sequences like welcome or onboarding emails. Frequent analysis helps catch issues early and optimize faster.
2. Can high open rates be misleading?
Yes. A high open rate doesn’t guarantee clicks or conversions. It could mean your subject line worked — but your content didn’t deliver. Always look at CTOR and CTR together with open rate.
3. What tools can I use to track advanced email metrics?
Advanced platforms like Klaviyo, ActiveCampaign, ConvertKit, and HubSpot provide in-depth reporting. You can also integrate Google Analytics with UTM tracking for behavioral insights.
4. Why is my unsubscribe rate increasing suddenly?
A spike in unsubscribes could mean your content is off-topic, you’re emailing too frequently, or your list has low engagement. Consider a re-engagement campaign or audience segmentation.
5. Should I delete inactive subscribers or try to re-engage them?
Try a re-engagement campaign first. If they don’t respond after a few emails, it’s best to remove them. Keeping inactive users can hurt your deliverability rate.
6. What’s the ideal number of CTAs in an email?
1 to 2 CTAs is ideal. Too many options confuse readers and dilute action. Use one primary CTA and optionally one secondary that supports the main message.
7. How do I know if my email subject line is underperforming?
Compare the open rate against your historical average and industry benchmark. If it’s 5–10% lower, try A/B testing subject lines with personalization or urgency triggers.
8. Are emojis in subject lines good or bad for metrics?
They can boost open rates if used sparingly and appropriately. But overusing them may trigger spam filters or look unprofessional in certain industries like finance or B2B.
9. What’s more important: a big list or a clean list?
A clean list always wins. It ensures better deliverability, higher engagement, and protects your sender reputation. A smaller, engaged list performs better than a massive unengaged one.
10. Do time zones affect email marketing metrics?
Absolutely. Sending at the wrong time of day can ruin open and click rates. Use tools that offer time zone-based scheduling or AI-optimized send times for best performance.